You Think You Have Observability. You Probably Have Monitoring.
Most engineering teams have dashboards and alerts. That's monitoring. Observability is something fundamentally different, and the gap between the two is where incidents hide; engineers burn out, and businesses lose money.
It's 2:17 AM. Your on-call engineer gets paged. The checkout is down. Latency is spiking. The dashboard is red. Your engineer opens 6 browser tabs (logs, metrics, APM traces, Slack, the deploy history, the runbook) and starts the forensics. Two hours and four engineers later, someone finds a database index that was accidentally dropped in a migration. The customers found out 40 minutes before you did.
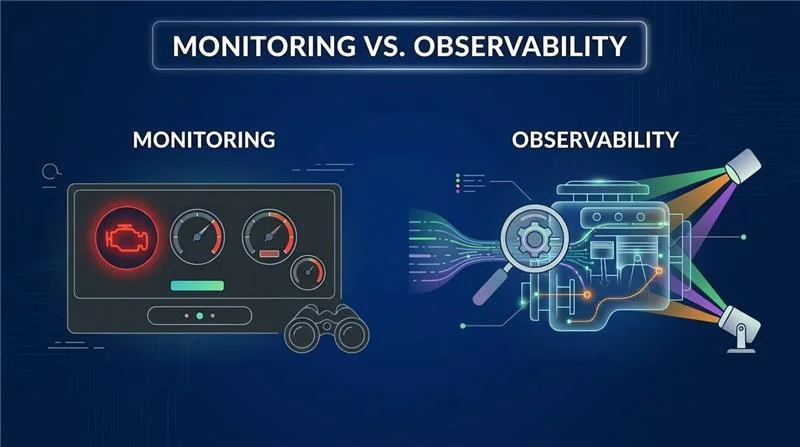
What is monitoring?
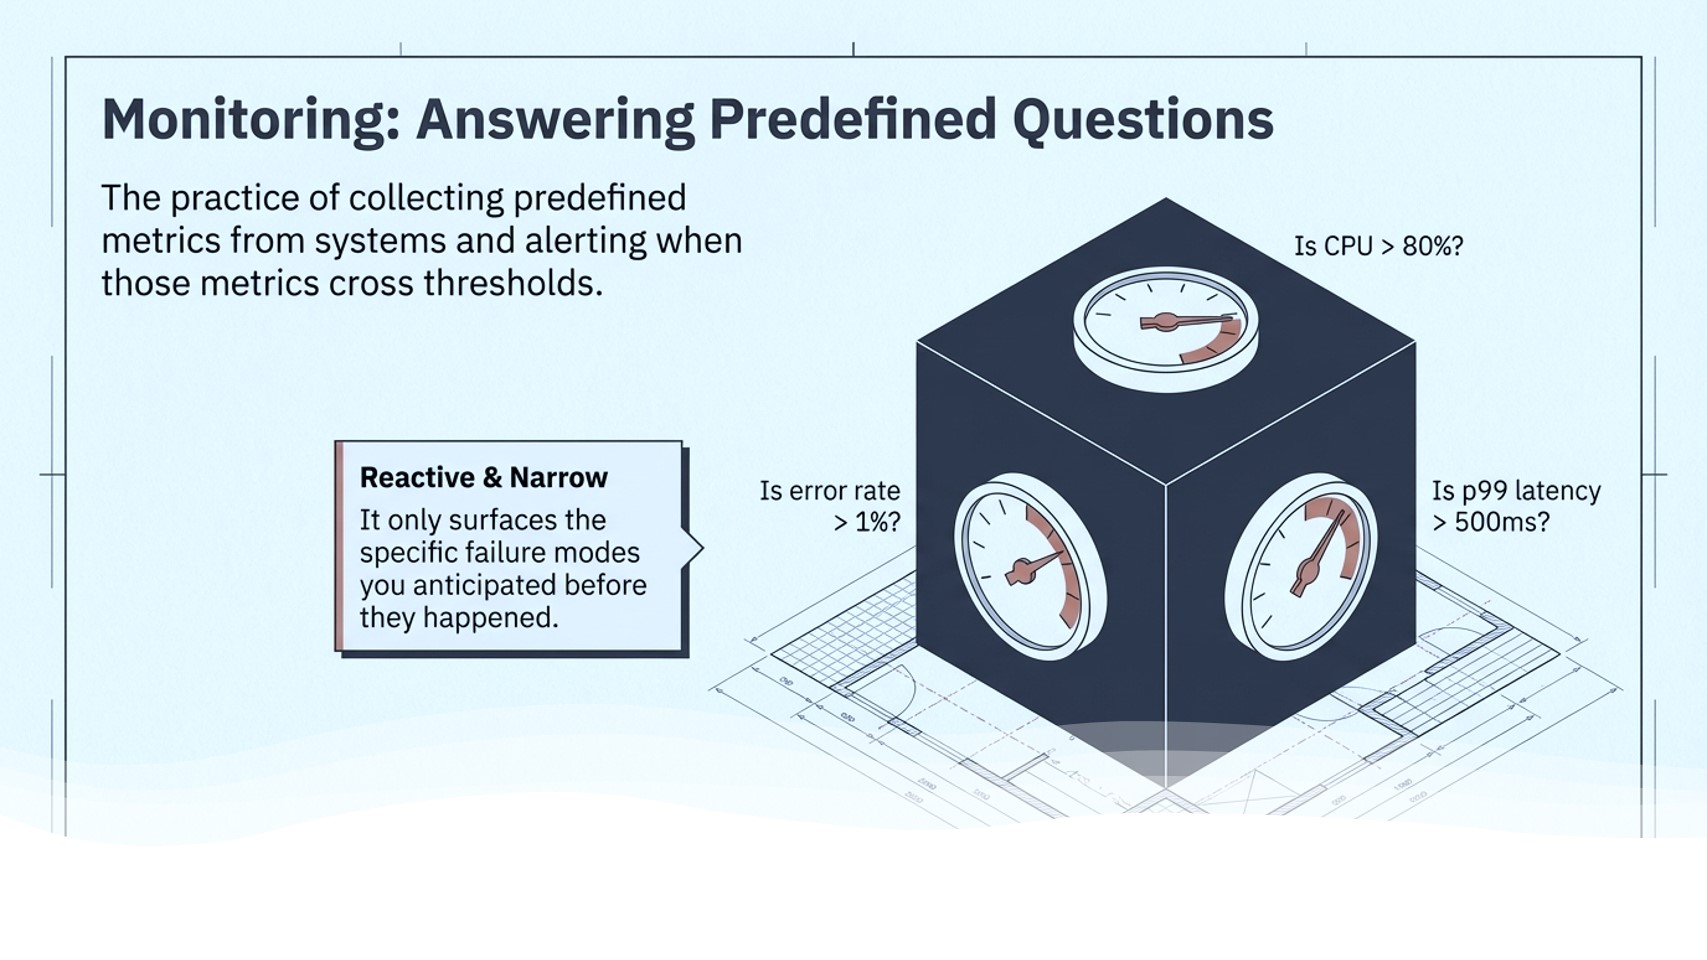
Monitoring is reactive and narrow. It can only surface failure modes you anticipated when you set up your dashboards. Unknown unknowns (the failures you didn't plan for) are invisible to it.
- Is this service up or down?
- Is CPU above 80%?
- Is error rate above 1%?
- Is p99 latency above 500ms?
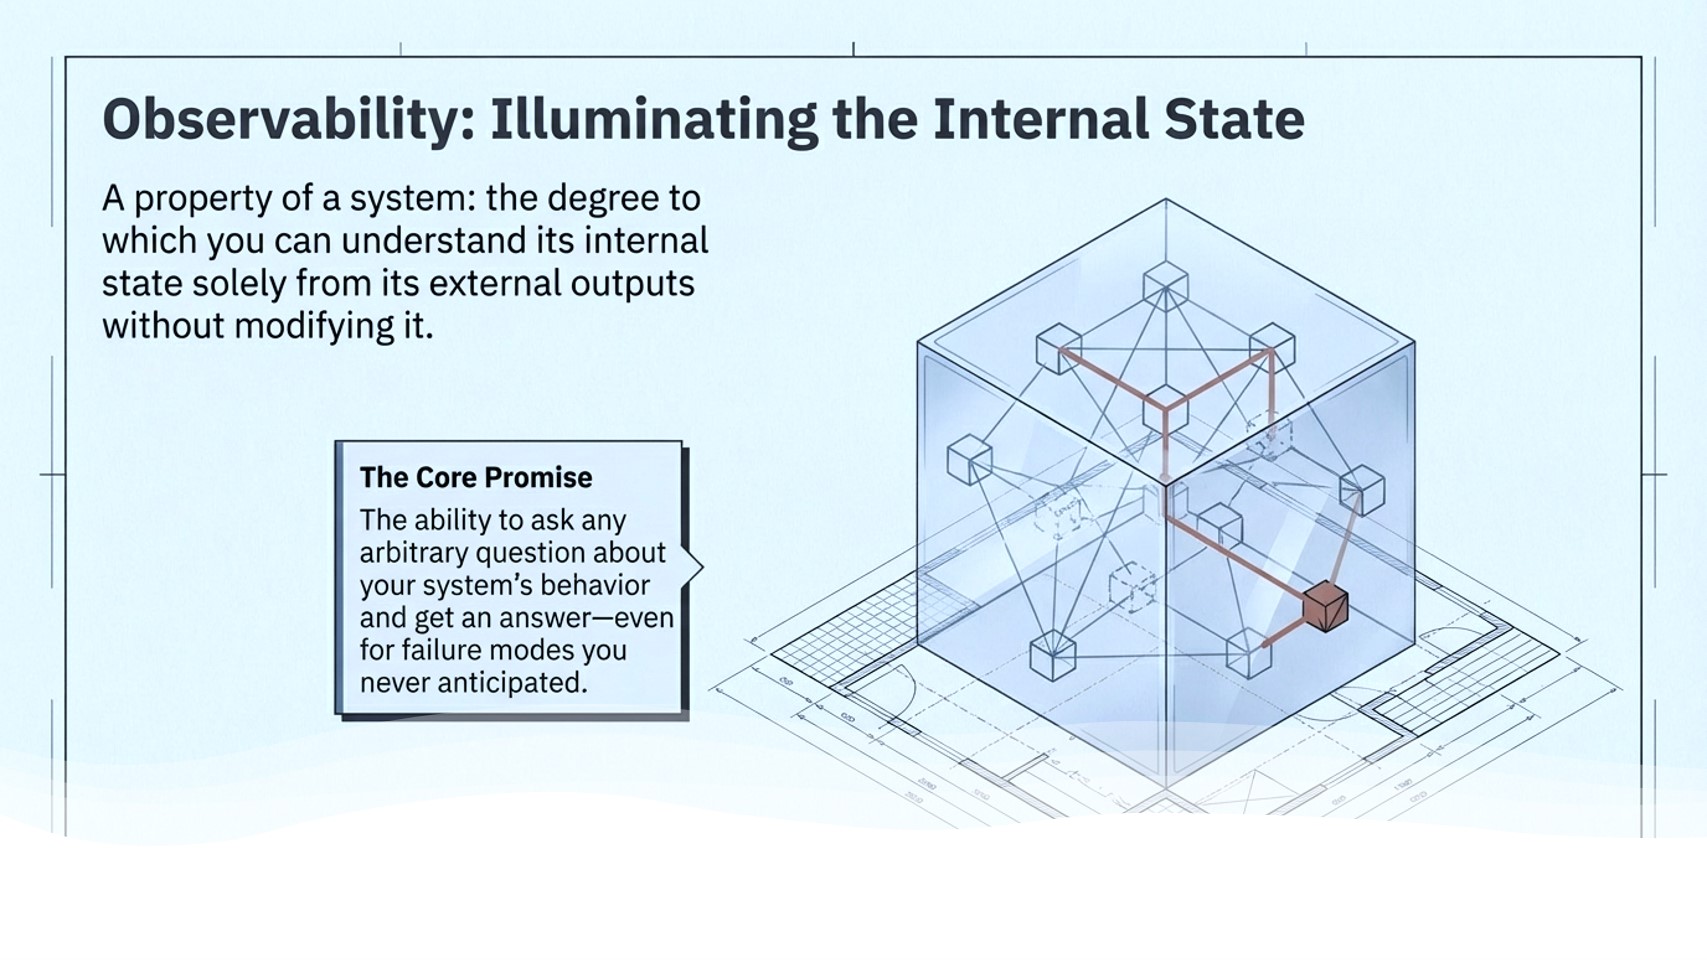
What is observability?
The critical difference: with full observability, you can ask any arbitrary question about your system's behavior and get an answer, even for failure modes you never anticipated.
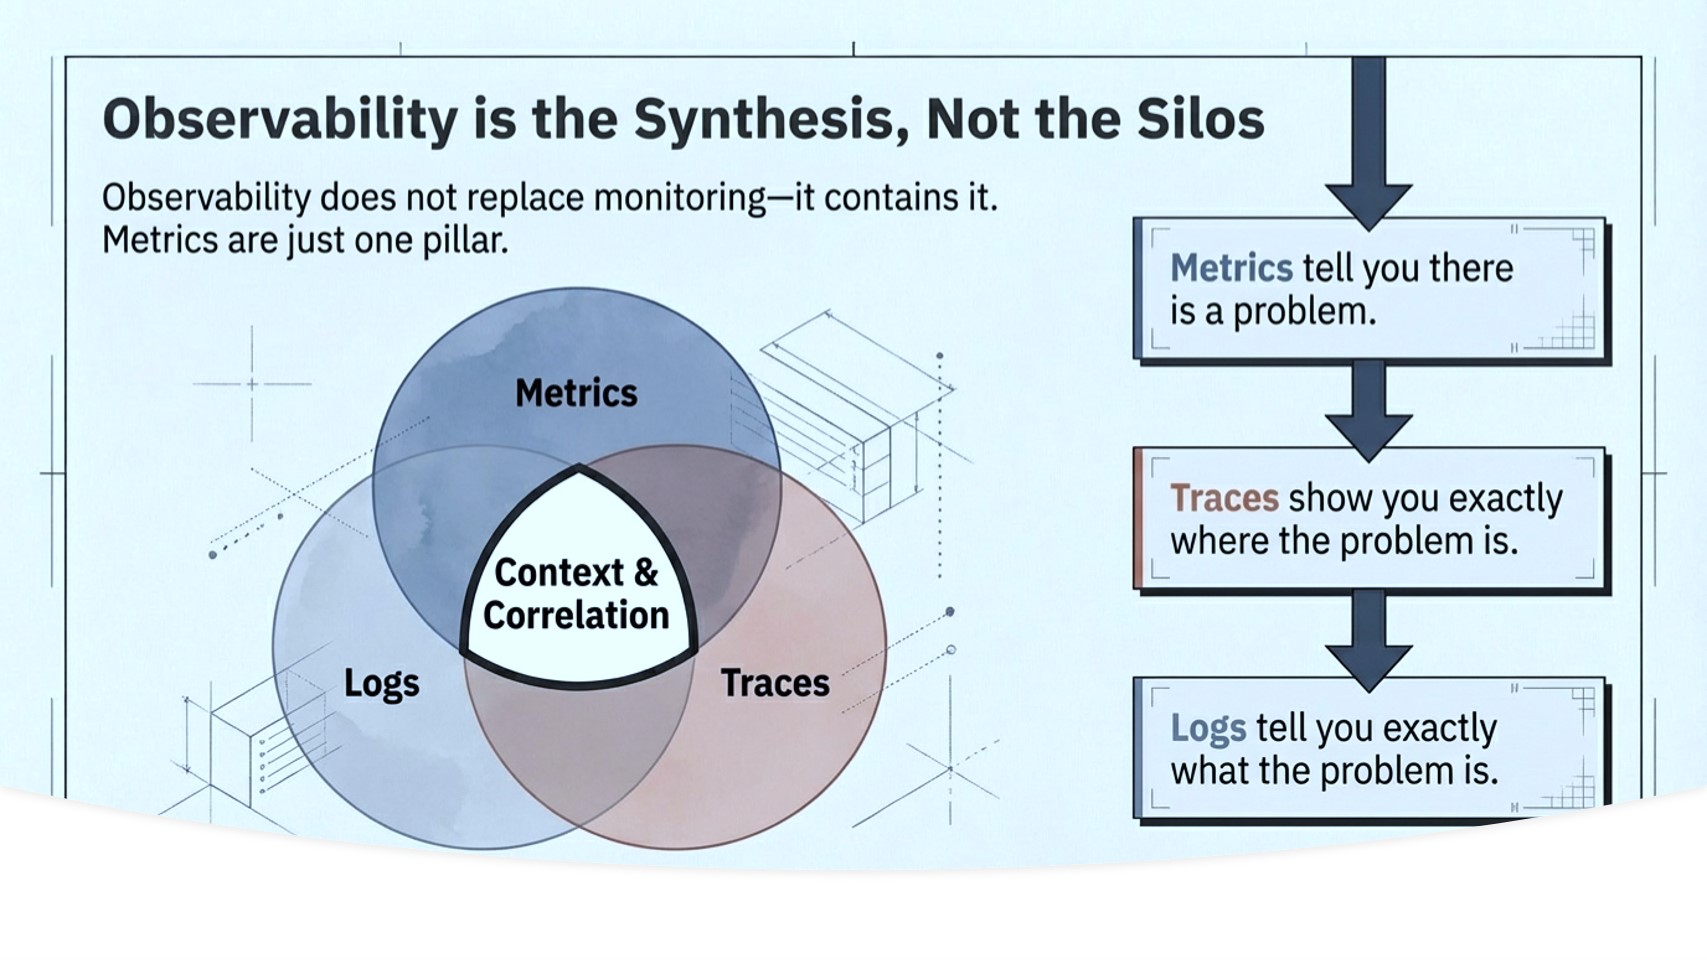
For software systems, observability is built from three types of telemetry data…
Side-by-side
Observability does not replace monitoring; it contains it. Metrics are one of the three pillars. The question is whether you stop there.
What good looks like
A fully observable system has these properties:
- You can ask any question about system behavior without deploying new code
- Every alert includes the context needed to act on it
- Correlated logs and traces, not just a metric value
- A single request can be traced end-to-end across all services it touched
- Anomalies surface before customers notice them
- Deployment confidence is high: you can see the effect of a change in real time
- Capacity and performance data is accurate enough for quarterly planning
Key takeaways
- Monitoring answers known questions. Observability lets you ask unknown ones.
- The three pillars of observability are metrics, logs, and traces, in combination, not isolation.
- The average MTTD without observability is 197 minutes. With it, detection and diagnosis collapse to minutes.
- Alert fatigue, on-call burnout, and slow deploys are symptoms of a monitoring gap, not an engineering problem.
- Full observability is achievable with open-source tooling. No vendor lock-in required.
The gap between monitoring and observability is where most hidden risks live. If you're exploring how to bridge that gap, connect with us at sales@minutuscomputing.com.