Full-Stack Observability: When Events Lead and Pillars Explain
A customer complains that payment is slow. Back at the engineering team, three people look at the same incident at the same time, each with a different tool.
Engineer A opens the metrics dashboard.
She sees the spike — latency crossed 3s at 14:09. Error rate is flat. CPU and memory look normal. She knows something happened. She does not know what.
Engineer B opens the log stream.
He filters to payment-service at 14:09 and sees a flood of "database query timeout" entries. He knows what happened. But he has no idea which upstream service triggered it or where in the stack the problem originated.
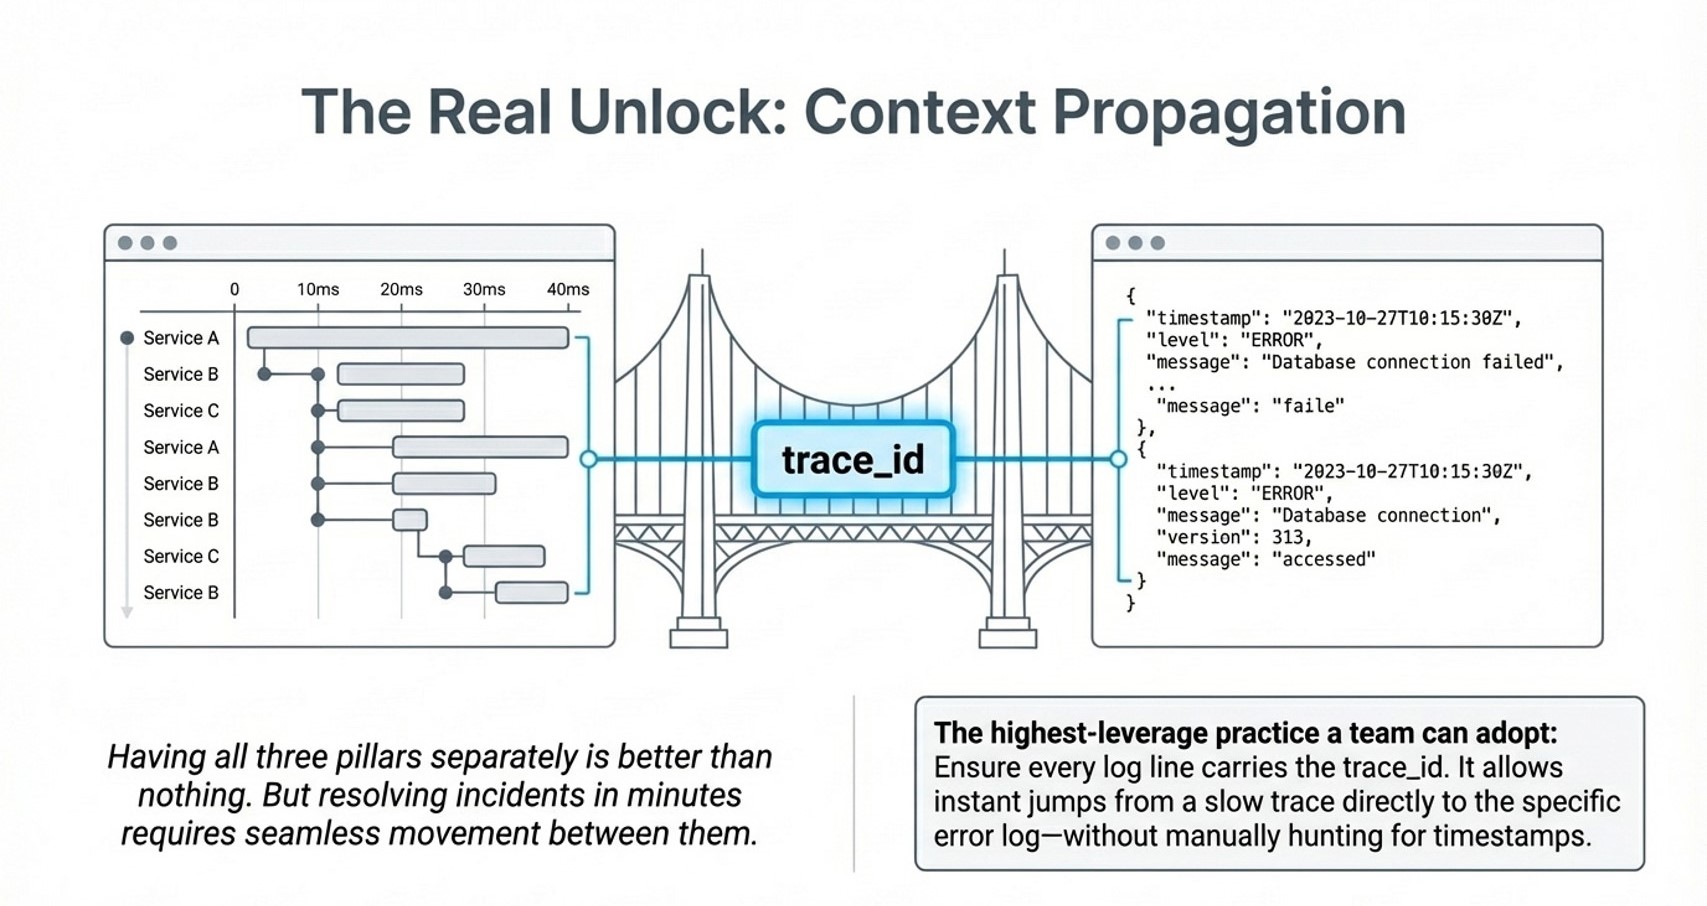
Engineer C opens the trace view.
She pulls a single failed request and sees the full journey: API gateway → order-service → inventory-service → payment-service → PostgreSQL. The DB call in payment-service took 2,840ms. She clicks the span, finds the query, and sees it is doing a full table scan on an unindexed column. That is the bug, found in about 90 seconds.
Pillar #4: Event — the event is the start, not the end
When customers say payments are not going through or are delayed, they are not being imprecise. They are giving you the most important signal available: something changed or broke. The investigation starts there.
What they are describing is an application event, and it is almost always earlier than any technical alert you would set. By the time your p99 latency alert fires, customers may have been failing at checkout for fifteen minutes. By the time a pod OOMKills, users may have been seeing blank screens for longer.
This is why events (business or technical) are the primary clue. They tell you when to look and roughly where. The three pillars tell you why.