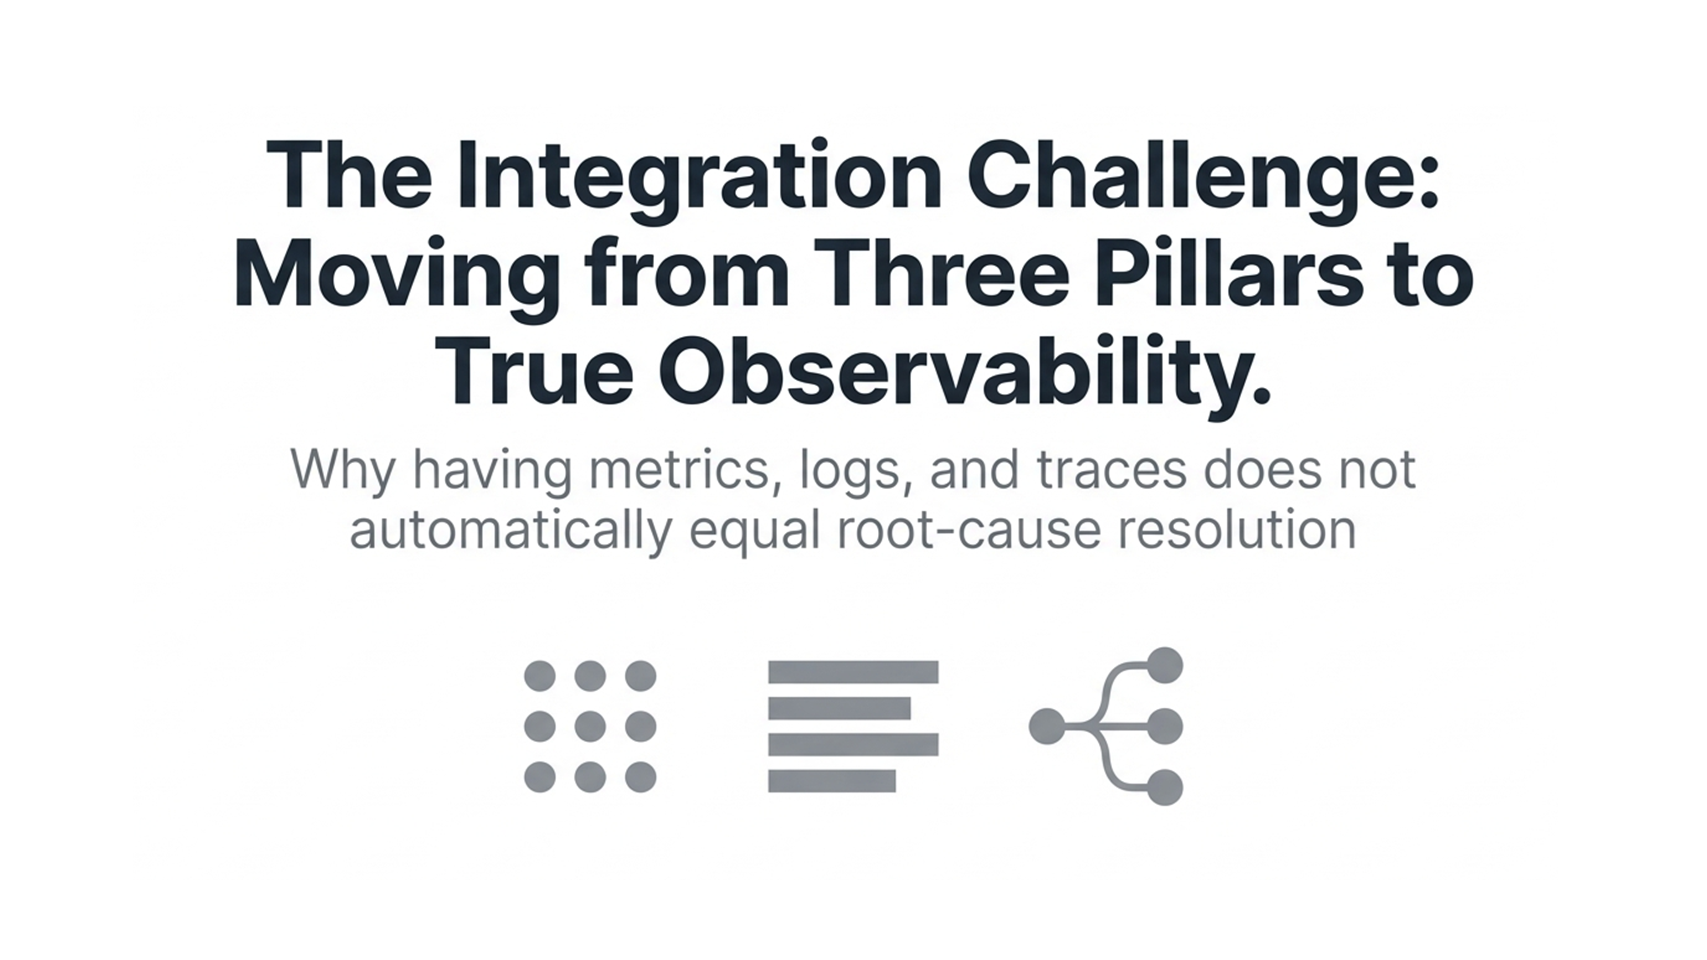
The fragmentation
Because these three pillars have distinct purposes and data types, they have different shapes and query patterns. Most teams end up with three separate systems, often from different vendors. Three pillars, three systems, three data types: one big integration challenge.
Let's understand more. Prometheus was set up by the infrastructure team to power the on-call dashboards. Elasticsearch was brought in by a developer who needed log search. Jaeger was added by a platform engineer experimenting with tracing. Each system has its own UI, its own query language, its own retention policy.
With this, the investigation workflow looks like this: an alert fires in Prometheus, an engineer opens Grafana to look at the metrics, opens Kibana to search the logs, opens the Jaeger UI to look at traces, switching between three separate tools, manually copying timestamps and service names from one to the next, trying to mentally join data that was never designed to be joined.
Deeper issue: without a shared data model, correlation is impossible to automate. An engineer has to correlate them manually, by timestamp and service name, a process that is slow, error-prone, and does not scale.
The different operational burdens
The integration problem isn't just about querying. Each system comes with its own operational overhead.
Metrics systems
Metrics systems need careful label design upfront.
- Cardinality explosion: Add too many high-cardinality labels and you create a cardinality explosion: running out of memory, query performance degrading, retention getting cut to manage storage.
- Schema rigidity: Metric schemas are hard to change once instrumented, because downstream dashboards and alerts depend on them.
Log systems
Log systems at scale are expensive.
- Cost drivers: Storing, indexing, and querying high-volume structured logs is one of the most significant cost drivers in observability.
- Per-GB pricing: The per-GB pricing models of commercial log vendors are notoriously painful as application volume grows.
Trace backends
Trace backends require instrumentation investment.
- Deliberate instrumentation: Unlike metrics (often scraped automatically from infrastructure) or logs (often emitted as a side effect of existing code), traces require deliberate instrumentation: every service needs to emit spans, every outbound call needs to propagate context.
- Broken propagation: If context propagation breaks anywhere in the chain, you get orphaned spans that don't link back to the root trace.
The broken correlation
The data was created by different instrumentation libraries with no shared context. Correlation requires a shared identifier, a field that appears in all three signal types for the same request. That identifier is the trace ID. But the trace ID only appears in all three signals if:
- The tracing instrumentation generates and manages it.
- The metrics instrumentation reads it from the current trace context and attaches it.
- The logging instrumentation reads it from the current trace context and injects it into every log entry.
Without a unified instrumentation layer that understands all three signal types and their shared context, you have to build this yourself, or accept that your three pillars will never be properly correlated.
The unified data model
The answer to the fragmentation problem is not to collapse three data types into one. Metrics, logs, and traces are different shapes because they serve different purposes, and that is appropriate. The answer is a shared context model that allows all three to reference the same request, the same service, and the same point in time.
This means:
- A log entry emitted inside a traced request automatically carries the trace ID of that request.
- A metric exemplar can carry a trace ID pointing to a representative trace for that data point.
- A trace span's attributes use the same naming conventions as your log fields and metric labels.
The data types stay separate, stored in optimized systems, but they have enough context between them to make navigation linked. A metrics spike can link you to traces, and from there to the log entry.
The collection problem
Even once the data model problem is solved, there is the collection problem. Each signal type has its own collection mechanism:
- Metrics are typically pulled or pushed.
- Logs are typically pushed.
- Traces are pushed.
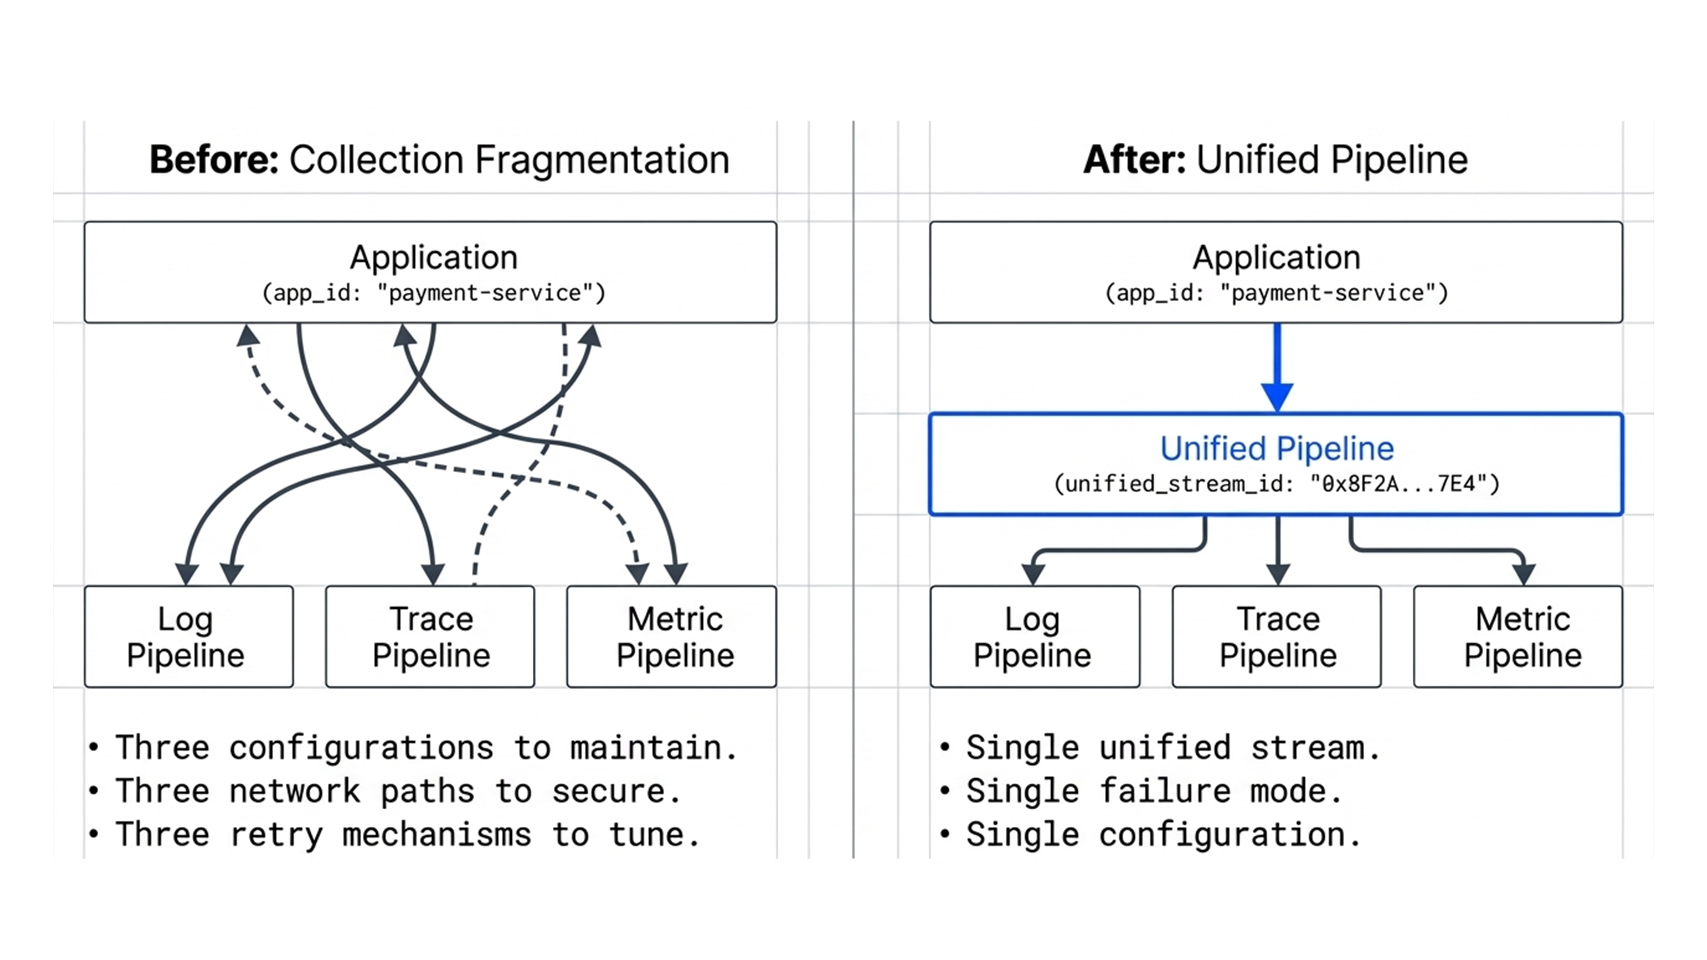
Running three separate collection pipelines means:
- Three configurations to maintain
- Three sets of network paths to secure
- Three retry and buffering mechanisms to tune.
When one pipeline falls behind under load, you lose a signal, often at exactly the moment you need it most.
Before you can have observability, the ability to ask arbitrary questions about your system's behavior and get answers, you have to solve two upstream problems:
- Data model fragmentation: your three signal types need a shared context so they can be correlated without manual effort.
- Collection fragmentation: your three signal types need a unified pipeline so you are not maintaining three separate collection systems with three separate failure modes.
Solve those two problems, and the three pillars stop being three separate islands and start being three views of the same system. Metrics show you the shape of what happened. Logs show you the detail of what happened inside a service. Traces show you the path of what happened across services. Because they all share context, you can navigate between them in seconds.
That is the difference between having monitoring tools and having observability.
If you are tightening how metrics, logs, and traces connect in your environment, we would be glad to help. Reach us at sales@minutuscomputing.com.