Instrumentation: Before Observability works, Your Code Has to Speak.
Metrics, logs, and traces don't appear by magic. Something must create them. That something is instrumentation, the code that makes your application report what it's doing. Here's what it means, how it works, and what good instrumentation looks like in production.
Your application is processing thousands of requests right now. It's calling databases, invoking downstream services, handling errors, retrying failed operations, and returning responses; all without telling anyone anything about how it's doing any of it.
By default, software is silent. It does its job. It reports nothing.
This is fine when everything works. It's catastrophic when something doesn't, because when a request fails or slows down, you have no record of what the application actually did. No timeline. No context. No evidence.
What does instrumentation actually mean?
The hospital patient monitor analogy:
A patient is in surgery. The surgeon is focused on the procedure. Meanwhile, a separate set of monitors tracks heart rate, blood pressure, oxygen saturation, and respiratory rate continuously, in real time, without interrupting the surgery.
The monitors don't change what the surgeon does. They surface what the patient's body is doing, so that if anything changes, the team knows immediately which number changed, when it changed, and by how much.
Your application is the patient. Instrumentation is the monitoring equipment. The surgery continues regardless but without the monitors, any change in the patient's condition goes undetected until it's too late.
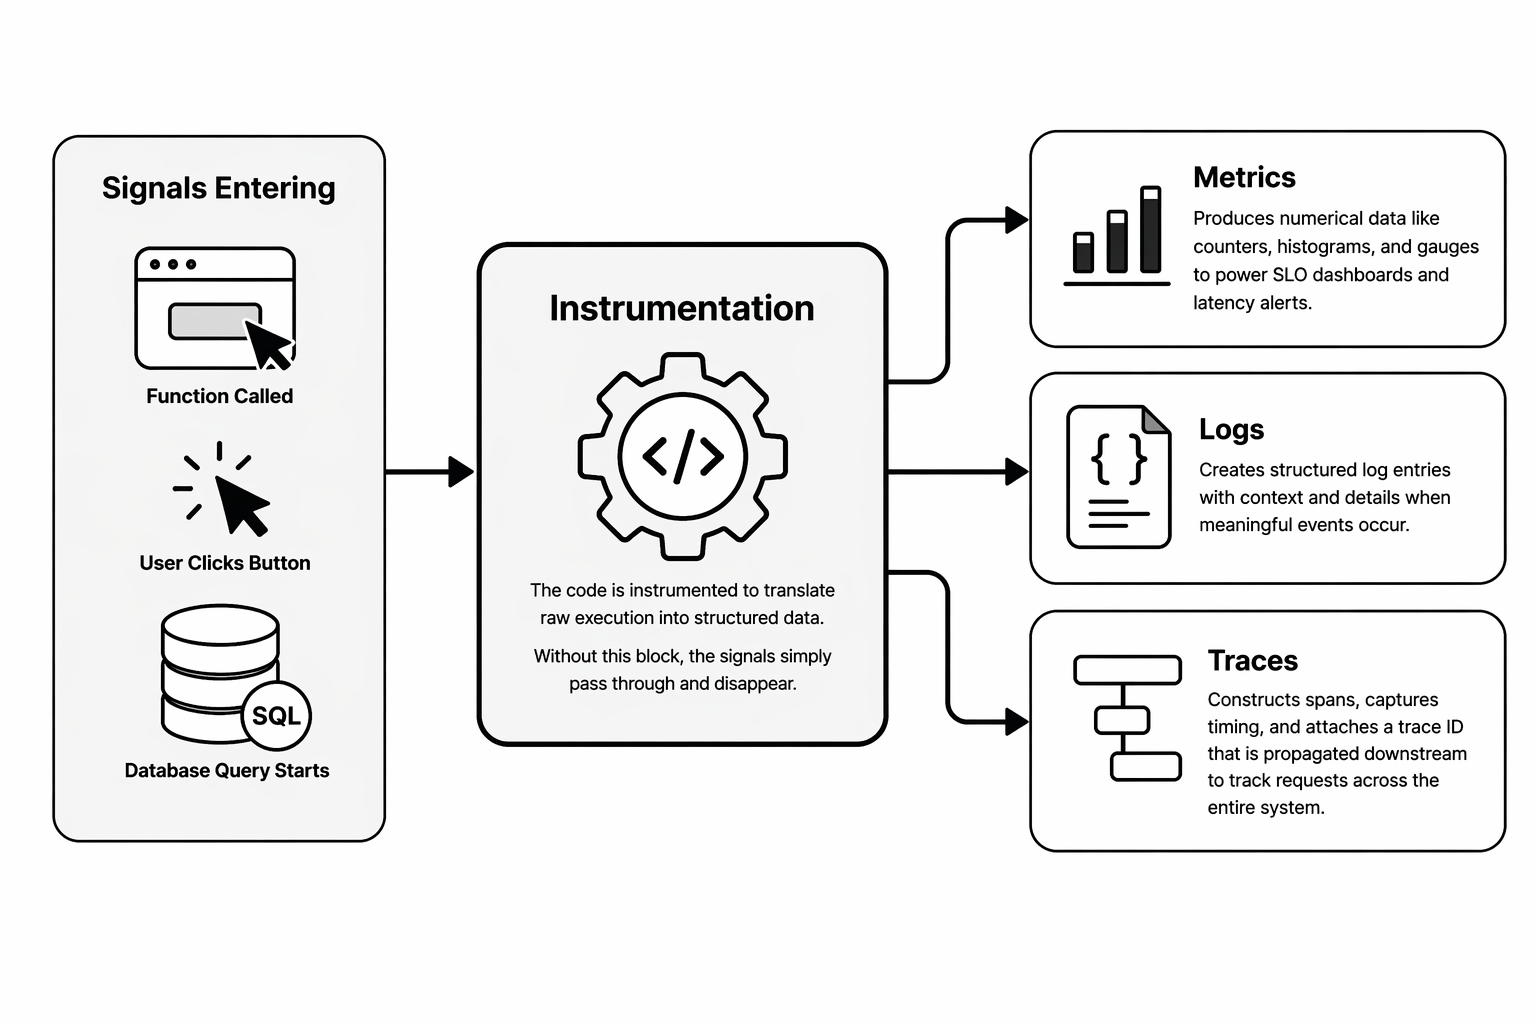
Instrumentation is the code that makes your application report what it's doing by generating the metrics, logs, and traces that observability tools collect and analyze.
What instrumentation produces: the three signals
- Metrics: Function time taken to execute produces the p99 latency.
- Logs: Event of login is successful, or your payment went through fine.
- Traces: Traces record all the background details of your login or payment system.
With instrumentation
- Every request produces a trace showing exactly where time was spent
- Every error produces a log entry with context about what the application was doing
- Every resource metric is continuously recorded and available for alerting
Auto-instrumentation and manual instrumentation
Auto-instrumentation: zero code changes.
Auto-instrumentation works by hooking into the runtime or framework layer of your application, intercepting calls to common libraries and automatically creating spans, metrics, and log entries without any changes to your application code.
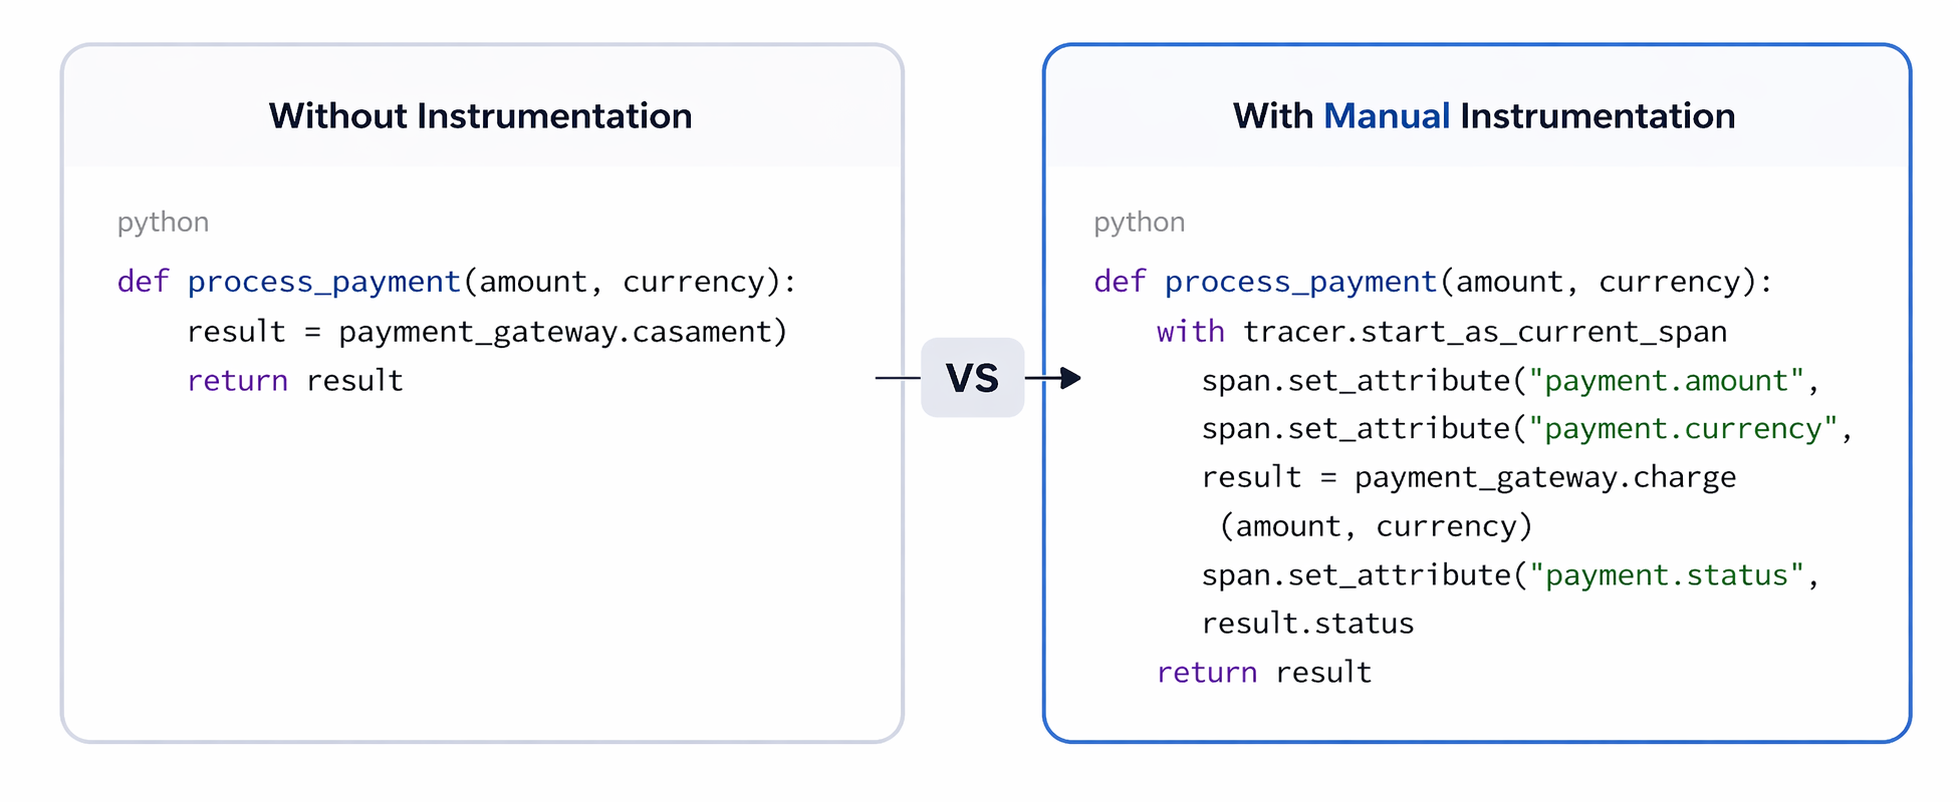
Manual instrumentation: business-logic visibility.
Manual instrumentation is where developers explicitly add spans, attributes, and log statements to their application code to capture business-level context that auto-instrumentation can't see.
What good instrumentation looks like
Good instrumentation has five properties:
- It covers every service boundary
- It carries meaningful attributes
- Logs carry the trace ID
- It is consistent across services
- It doesn't over-instrument
If you’ve grasped instrumentation, you’re ready for the piece that ties everything together the framework that’s made vendors irrelevant and future-proofed modern systems.
Coming up: What OpenTelemetry really is and why the entire industry aligned around it.