
What is OpenTelemetry and Why Has Every Major Cloud and Observability Vendor Adopted It?
OpenTelemetry is not a monitoring tool, a dashboard, or a backend. It is the instrumentation standard the industry has converged on, so you can instrument your systems once, in a vendor-neutral format, and send telemetry anywhere without rewriting a line of code.
It's 2019. Your engineering team evaluates observability platforms and picks one. You install the vendor's agent, add their SDK to each service, and instrument your code using their proprietary libraries.
Two years later the bill has tripled. Leadership asks engineering to evaluate alternatives.
The answer from the team: "We can't easily switch. Our instrumentation is tightly coupled to this vendor's SDK. Every span, every metric, every log is emitted using their API. Migrating means re-instrumenting every service from scratch, we're looking at four to six months of work across the whole backend."
That conversation has happened at hundreds of engineering organizations. Different vendors, same answer every time. Because until 2019, it was completely unavoidable, every observability platform shipped its own proprietary instrumentation SDK, and using one meant being permanently coupled to it. The moment you have instrumented your code; you had made a decision that would cost months to reverse.
OpenTelemetry is the answer to a question every engineering team eventually asks: why should our instrumentation code care which vendor we're sending data to?
What OpenTelemetry is not…
Let's clear up the most common source of confusion around OTel (OpenTelemetry)…
OpenTelemetry is not:
- A monitoring or alerting platform
- A metrics storage backend
- A log aggregation system
- A tracing backend
- A dashboard tool
- A replacement for any existing backend or visualization tool
It sits entirely upstream of all of those. It does none of those things. OTel's job is to get telemetry data out of your application and into your chosen backend in a standardized format, without coupling your code to any specific destination.
So, what OpenTelemetry actually is…
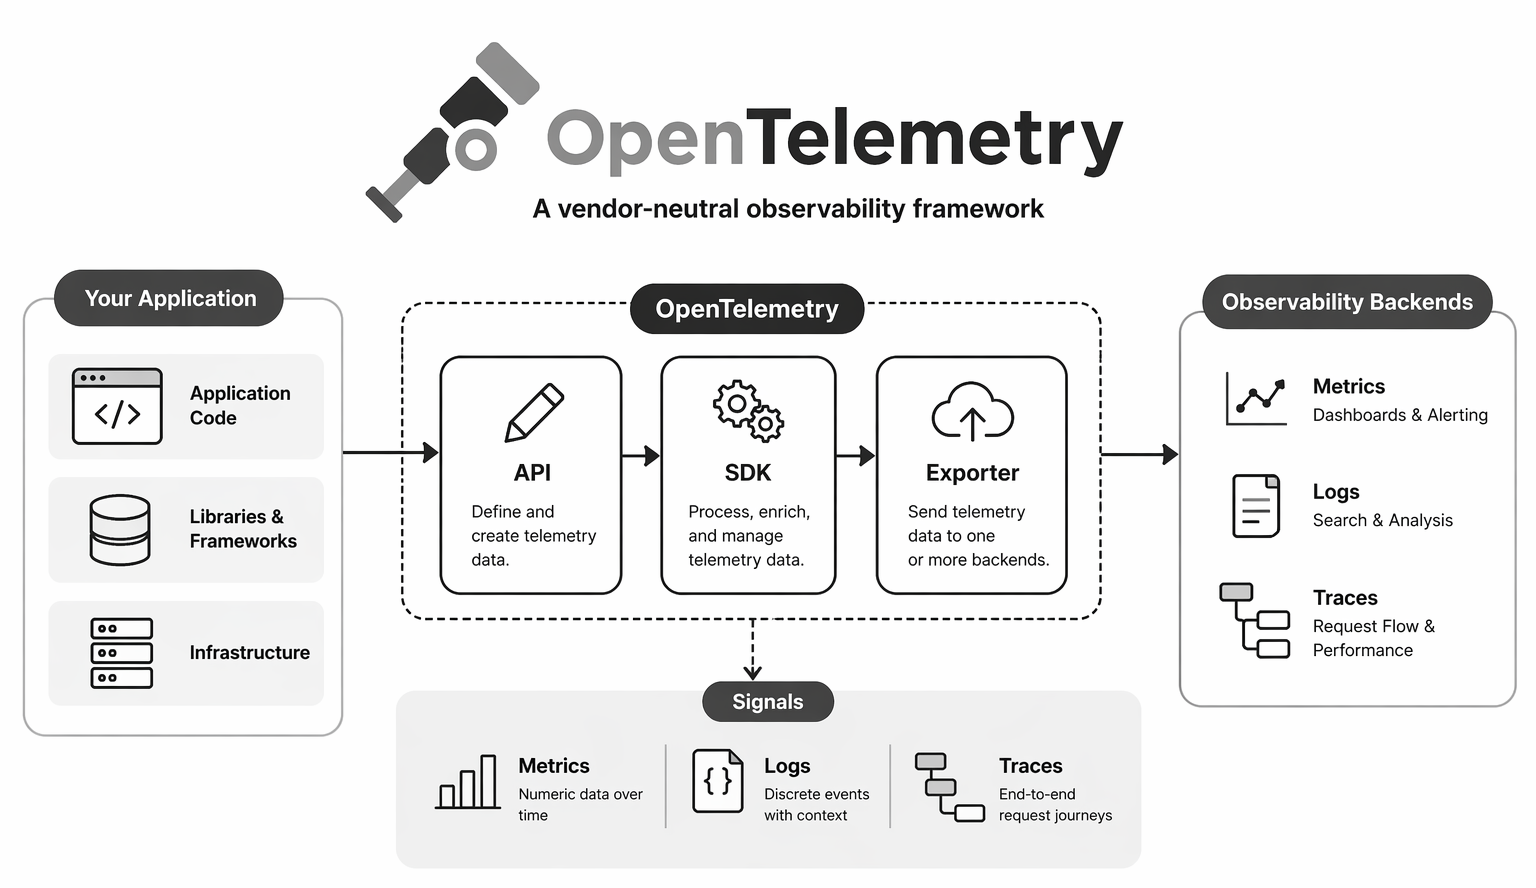
OpenTelemetry is a collection of APIs, SDKs, tools, and a collector for instrumenting software, generating and collecting metrics, logs, and traces from applications and infrastructure in a standardized, vendor-neutral format.
It was created in 2019 by merging two earlier CNCF project, OpenCensus (from Google) and OpenTracing into a single unified standard. It is now the second most active CNCF project by contributor count, after Kubernetes.
OTel components
The API instruments your code, the SDK processes what's collected, and the Collector routes it to wherever you want it to go.
The API - language-specific interfaces for creating spans, recording metrics, and emitting logs. Your application code calls the API.
The SDK - the implementation of the API. Handles sampling, processing, and exporting. Configured at startup, not in application code.
The Collector - a standalone service that sits between your applications and your backends. It receives telemetry data from your services, processes it (filtering, batching, enriching, transforming), and exports it to one or more backends simultaneously.
The problem it solved: instrumentation lock-in

Adopting OTel instrumentation today means your organization will never face an instrumentation migration project again, regardless of which backend you choose now or in the future."
Why the entire industry adopted it
OpenTelemetry's contributor list reads like a who's who of the observability industry:
- Microsoft
- Amazon Web Services
- Datadog
- Splunk
- Dynatrace
- Honeycomb
- Lightstep (acquired by ServiceNow)
- New Relic
- Grafana Labs
When competing commercial vendors, companies whose revenue depends on you using their proprietary tooling all contribute to the same open standard, that standard has effectively won. No vendor wants to be the one that doesn't support OTel, because engineering teams are now actively selecting stacks that are OTel-compatible.
What universal backend support means for you
Every major observability backend now accepts OTel data natively:
- Datadog has an OTel-native ingest path
- Splunk supports the OTel Collector as a primary data source
- AWS X-Ray, Google Cloud Trace, and Azure Monitor all support OTel
- Prometheus, Grafana Tempo, and Jaeger are OTel-native by design
This means: instrument with OTel today, and your telemetry can go to any of these backends now or in the future. The instrumentation decision is permanently decoupled from the vendor decision.
The OTel Collector: the routing layer
The OTel Collector is a standalone service typically deployed as a sidecar alongside your applications or as a centralized gateway that acts as the routing layer between your instrumented services and your chosen backends.
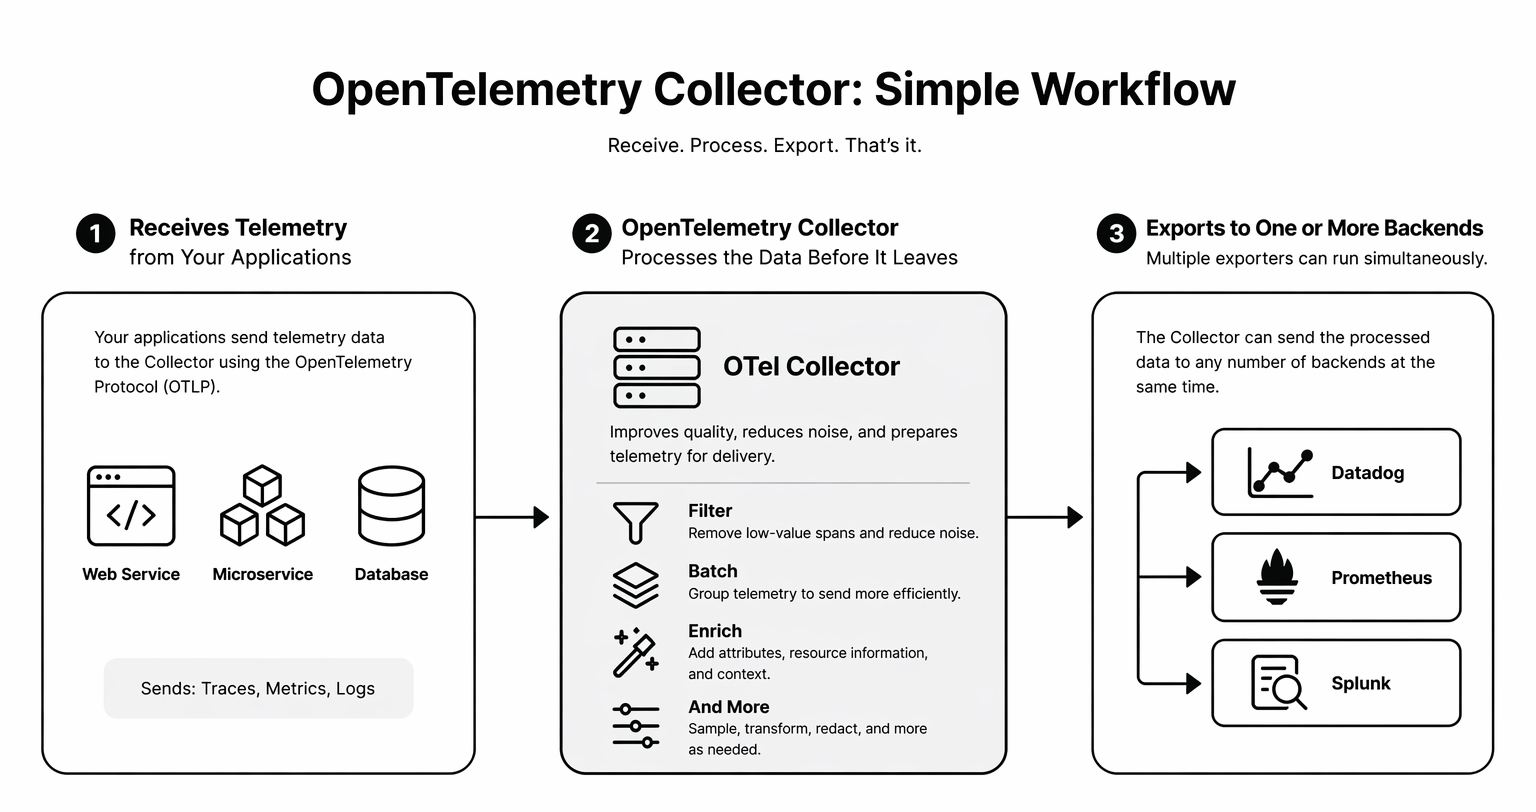
The Collector is where vendor independence lives in practice. Your applications emit to the Collector in a standard format. The Collector routes to backends. Changing backends means changing Collector configuration, a YAML file not application code.
Interested to know what adoption looks like? Feel free to approach us at sales@minutuscomputing.com for Open-Source Observability Architecture assistance full OTel Collector configuration, backend wiring diagrams, auto-instrumentation setup by language, and a clear migration path.