
Minutus Computing enables banking customer to Monitor Network and Infrastructure
Overview
Minutus computing has implemented comprehensive monitoring solutions to enhance the visibility and management of a complex network infrastructure. We ensured proactive issue resolution, maintained optimal performance & uptime. By leveraging advanced monitoring tools, the solution aimed to provide real-time insights into network health, enabling timely identification and resolution of potential issues.
Primary Goals and Objectives
Monitor Devices:
- Ensure continuous monitoring of VMs, Network switches, routers & firewall within the local and remote network.
Centralized Visualization:
- Utilize a single platform to visualize and manage device performance and health.
Proactive Issue Identification:
- Implement alerting mechanisms to detect and address issues promptly.
Features and Functionalities
Visualization Tool:
- Grafana used to create comprehensive dashboards for real-time monitoring.
Alerting System:
- Zabbix configured to send email alerts for critical thresholds, ensuring immediate response to potential issues.
Key Deliverables and Milestones
1. Initial Setup and Configuration
Installation:
Successfully installed and configured Zabbix and Grafana on the client's infrastructure.
Configuration:
Customized Zabbix to monitor specific metrics relevant to Patel Wealth's operations.
Device Setup:
Integrated 50+ devices into the monitoring system, ensuring network connectivity and accessibility.
Reporting:
Logs and reports as per requirement in CSV format.
2. Dashboard Creation
Customized Dashboards:
Developed tailored dashboards in Grafana to provide real-time insights into key performance metrics such as CPU usage, memory utilization, and network traffic.
User-Friendly Visualizations:
Created intuitive visualizations to help the client's IT team quickly identify and address issues.
3. Testing and Validation
Data Accuracy:
Conducted thorough testing to ensure accurate data collection and visualization.
Performance Testing:
Ensured the system could handle the load and scale as needed.
Alert Validation:
Verified the alerting mechanisms to ensure they function correctly and provide timely notifications.
4. Training and Handover
Training Sessions:
Conducted comprehensive training sessions for the client's IT team to ensure they are proficient in using the monitoring tools.
Documentation:
Delivered detailed documentation and user guides to support ongoing use and maintenance of the system.
Challenges
Scalability & Future-Proofing:
Designed the monitoring system to scale with the client's growth, ensuring it can accommodate additional devices and increased data volume.
Resource Planning:
Planned for future resource requirements to support the expanded monitoring needs.
Dashboard Snapshots
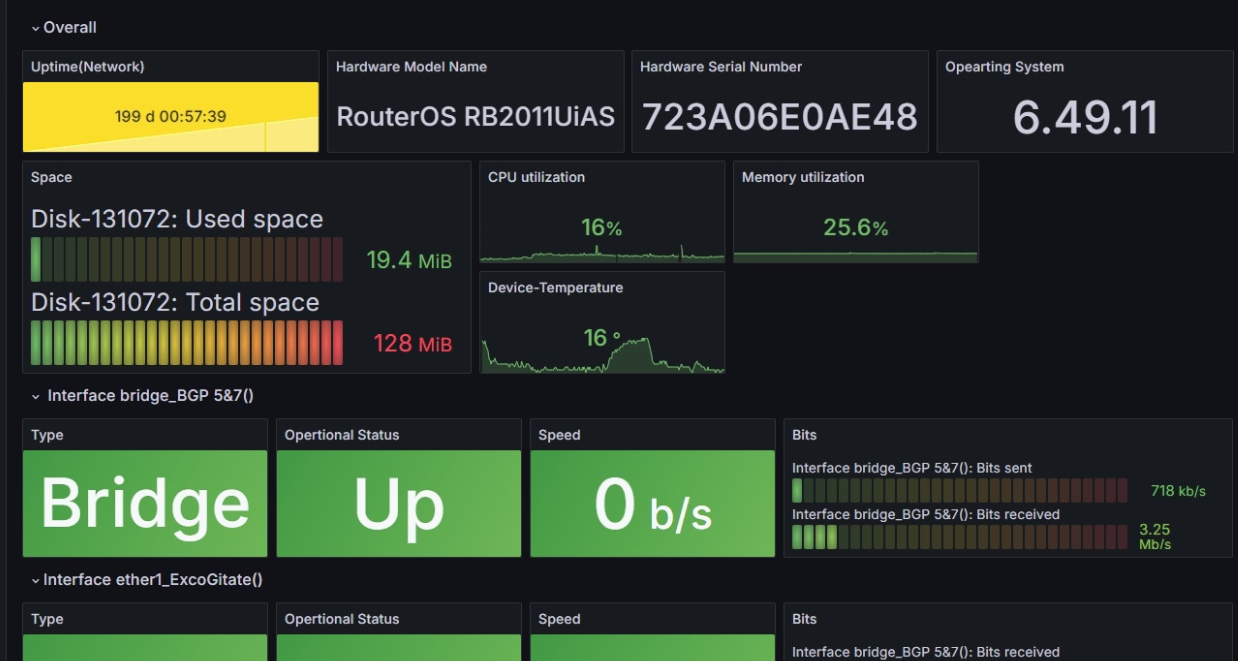 Detailed Dashboard of Router
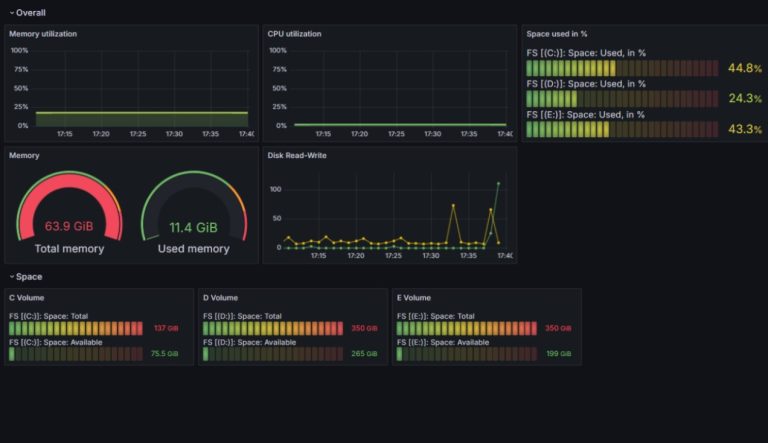 Detailed Dashboard of Server
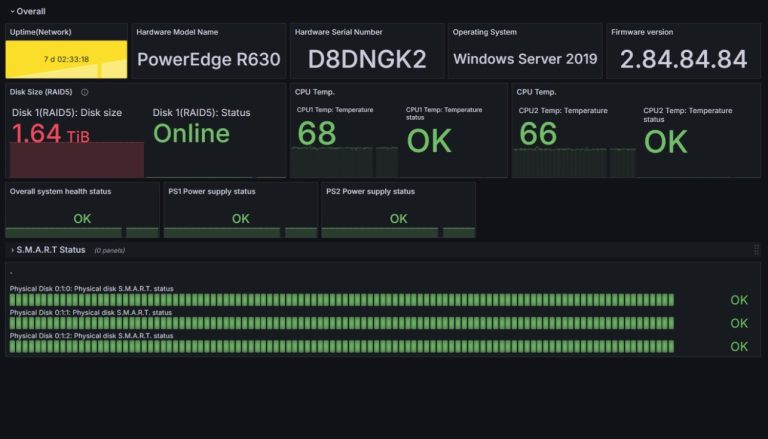 Detailed Dashboard of Rack Server
Conclusion
The implementation of Zabbix and Grafana for monitoring 50 devices at Patel Wealth has significantly improved the visibility and management of their network infrastructure. The customized dashboards and alerting systems have enabled proactive issue identification and resolution, leading to enhanced operational efficiency and reduced downtime. The project has successfully met its primary goals and objectives, providing a robust and scalable monitoring solution for the client.